320x100
320x100
0. 준비
- pip install matplotlib
: 그래프 출력을 위한 matplotlib 다운로드
- pip install seaborn
: 그래프에 격자 표시등의 모양을 위한 seaborn 다운로드
- pip install numpy
: 그래프를 출력할 예제 배열 데이터 생성을 위한 numpy 다운로드
1. 예제
# jupyter notebook 내에서 그래프를 보기 위한 %inline
%matplotlib inline

import matplotlib.pyplot as plt
import seaborn as sns

x = np.linspace(0,10,1000)
y = np.power(x,2)
plt.plot(x,y)
plt.show()
import matplotlib.pyplot as plt, numpy as np

# 1950부터 2011까지 10씩 증가하는 리스트
years = [x for x in range (1950,2011,10)]

# 300부터 10000까지 범위의 7개의 난수리스트
gdp = [x for x in np.random.randint(300,10000,size=7)]

plt.plot(years, gdp, color='green', marker='o', linestyle='solid')
plt.show()
import matplotlib.pyplot as plt, numpy as np

# 1950부터 2011까지 10씩 증가하는 리스트
years = [x for x in range (1950,2011,10)]

# 300부터 10000까지 범위의 7개의 난수리스트
gdp = [x for x in np.random.randint(300,10000,size=7)]

# color는 16진수로도 작성가능
# marker에 대한 정보 세팅
plt.plot(years, gdp, marker='o', markersize=8, markeredgewidth=1,
         markeredgecolor='red', markerfacecolor='green', linestyle='solid')
plt.show()
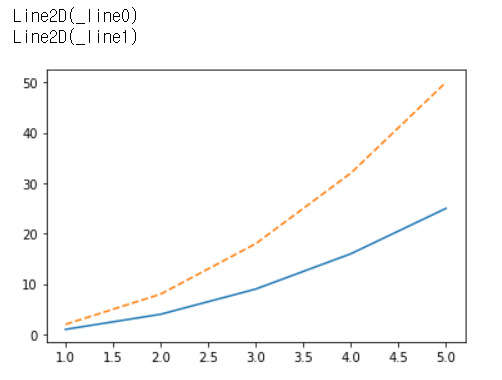
import numpy as np, matplotlib.pyplot as plt

x= np.array([1,2,3,4,5])
y=np.array([1,4,9,16,25])

line1, line2 = plt.plot(x, y, '-', x,y*2,'--')
print(line1)
print(line2)
plt.show()
300x250
728x90
'Programming > Programming' 카테고리의 다른 글
| VS Code go 사용하기 (0) | 2021.12.15 |
|---|---|
| 아나콘다 가상환경 관리 (0) | 2021.04.27 |
| 파이썬 웹 크롤링 - 자동검색 프로그램 (0) | 2020.11.06 |
| 파이썬 기초 - 예외처리 (0) | 2020.11.06 |
| 파이썬 기초 - 함수와 모듈 (0) | 2020.11.06 |