320x100
320x100
Multionmial Classfication
- 클래스가 여러개일때의 분류
- 활성화 함수로 softmax를 주로 활용
softmax를 활용한 다중 클래스 분류 파이썬 예제
import tensorflow as tf

xy_data=np.array([
    [1,2,1,1,2],
    [2,1,3,2,2],
    [3,1,3,4,2],
    [4,1,5,5,1],
    [1,7,5,5,1],
    [1,2,5,6,1],
    [1,6,6,6,0],
    [1,7,7,7,0]
])                           # 데이터셋 정의

x_data=xy_data[:,0:-1]       # 원본 행렬에서 오른쪽 끝 열을 제외한 행렬
y_data=xy_data[:,-1]         # 원본 행렬에서 오른쪽 끝열만 추출한 벡터
nb_classes = 3               # 클래스의 갯수 (0차원 ~ 2차원까지의 차원의 수 표현)
print('\nx_data=\n', x_data)
print('\ny_data=\n', y_data)

Y_one_hot = tf.one_hot(y_data, nb_classes).numpy()   # one_hot_encoding (데이터, 차원의 수)
print('\nY_one_hot=\n', Y_one_hot)


W=tf.Variable(tf.random.normal([4,nb_classes]), name='weight')  # 가중치 정의 (4,3 형태의 난수 행렬)
B=tf.Variable(tf.random.normal([nb_classes]), name='bias')      # 편향 정의 (3, 형태의 난수 행렬)

@tf.function
def Hypothesis(X):                                              # 가설 정의
    logits=tf.add(tf.matmul(tf.cast(X,tf.float32),W),B)         # cast = 매개변수 X가 실수형일때 true출력
                                                                # (데이터 * 가중치) + 편향
    return tf.nn.softmax(logits)                                # softmax함수로 활성화 실행

@tf.function
def loss(H, Y):                                                 # 손실함수 정의
    entropy=-tf.reduce_sum(Y*tf.math.log(H), axis=1)            # 엔트로피 정의 (데이터셋을 Log값으로 변환)
    cost = tf.reduce_mean(entropy)                              # 손실함수를 크로스 엔트로피로 정의
    return cost

@tf.function
def train(X,Y, learning_rate=0.1):            # 오차를 줄이기 위한 모델 훈련
    with tf.GradientTape() as tape:
        _loss=loss(Hypothesis(X),Y)
    _w,_b=tape.gradient(_loss, [W,B])
    W.assign_sub(learning_rate * _w)         # 가중치 조절
    B.assign_sub(learning_rate * _b)         # 편향 조절

@tf.function
def evaluation(H,Y):                                                  # 검증 함수
    prediction=tf.argmax(H,1)                                         # 예측 값 (데이터 셋에서 최대 값의 인덱스 추출)
    correct_prediction=tf.equal(prediction, tf.argmax(Y,1))           # 예측 값 비교 (H벡터와 Y벡터를 비교하여 최대 값의 인덱스가 같은지 비교)
    accuracy=tf.reduce_mean(tf.cast(correct_prediction, tf.float32))  # 최대 값의 인덱스의 MSE
    return prediction, accuracy                                       # 최대 값 인덱스와 정확도 반환

for step in range(2001):                            # 모델을 2000번 훈련
    _c=loss(Hypothesis(x_data), Y_one_hot)
    train(x_data, Y_one_hot, learning_rate=0.1)     # 학습률 0.1로 하여 모델 1회 훈련
    if step%100 ==0:
        print(f"step:{step}\tloss:{_c.numpy()}")    # 훈련 100회당 1회 출력

print("\nAccuracy...")
_h=Hypothesis(x_data)                # 변환된 원본 데이터
_p, _a=evaluation(_h, Y_one_hot)     # 예측 값
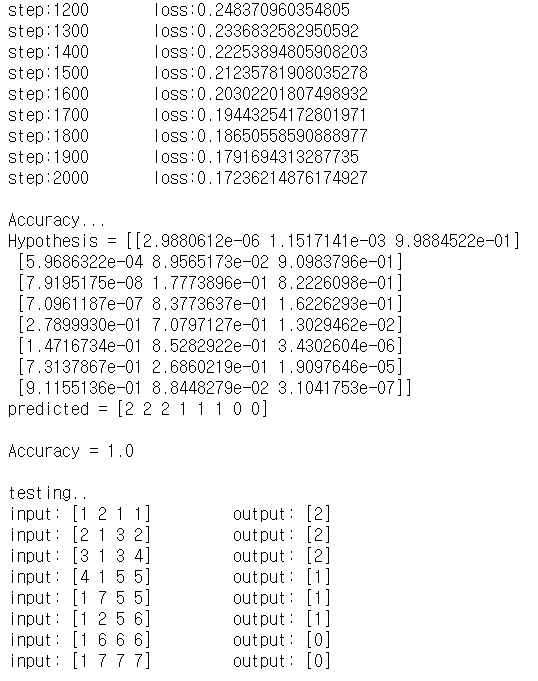
print("Hypothesis =",_h.numpy())
print("predicted =",_p.numpy())
print("\nAccuracy =", _a.numpy())

# 테스트
test_data = np.array([
    [1,2,1,1],[2,1,3,2],[3,1,3,4],[4,1,5,5],[1,7,5,5],[1,2,5,6],[1,6,6,6],[1,7,7,7]])
print("\ntesting..")
for data in test_data:
    result = tf.argmax(Hypothesis([data]),1)
    print(f"input: {data}\t output: {result}")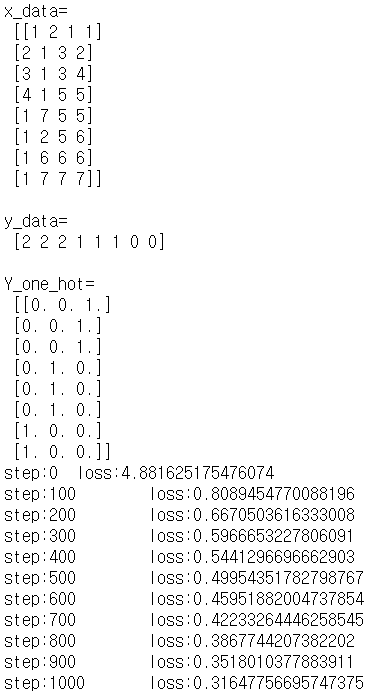
- one_hot_encoding 이란?
: 집합의 크기를 벡터의 차원으로 취급하고 표현하고자 하는 값의 인덱스에 1을 부여하고
나머지 인덱스에는 0을 부여하는 벡터 표현 방식
=> softmax를 통해 최대 값의 인덱스를 추출하고 one_hot_encoding을 통해 표현
softmax를 활용한 MNIST 데이터셋 분류 파이썬 예제
# softmax classification for Mnist Dataset
import tensorflow as tf

mnist = tf.keras.datasets.mnist
(x_train, y_train), (x_test, y_test) = mnist.load_data()    # MNIST 데이터 셋 로드
x_train, x_test = x_train/255.0, x_test / 255.0             # MNIST의 x_train과 x_test 데이터를 255픽셀의 이미지로 설정

x_train = x_train.reshape(60000,784).astype('float32')     # x_train을 (60000,784)모양의 실수 행렬로 변환
x_test = x_test.reshape(10000,784).astype('float32')       # x_test를 (10000,784)모양의 실수 행렬로 변환

nb_classes=10           # 차원의 갯수 10

y_train_one_hot = tf.one_hot(y_train, nb_classes).numpy()  # y_train one_hot_encoding
y_test_one_hot = tf.one_hot(y_test, nb_classes).numpy()    # t_test one_hot_encoding

W=tf.Variable(tf.random.normal([784,nb_classes]), name='weight')  # 가중치 정의 (784,10)모양의 난수 행렬
B=tf.Variable(tf.random.normal([nb_classes]), name='bias')        # 편향 정의 10, 모양의 난수 행렬

@tf.function
def Hypothesis(X):                                            # 가설 정의
    logits=tf.add(tf.matmul(tf.cast(X,tf.float32),W),B)       # logit 정의 (softmax 입력에 쓰이기 위함)
    return tf.nn.softmax(logits)                              # softmax로 활성화


@tf.function
def loss(H, Y):                                               # 비용 함수 정의
    entropy=-tf.reduce_sum(Y*tf.math.log(H), axis=1)          # 엔트로피 정의 (log 함수)
    cost = tf.reduce_mean(entropy)                            # 크로스엔트로피로 비용함수 정의
    return cost

@tf.function
def train(X,Y, learning_rate=0.1):          # 손실률이 최소화 되도록 훈련 (학습률은 0.1)
    with tf.GradientTape() as tape:         # 기울기 연산을 위한 손실값 기록
        _loss=loss(Hypothesis(X),Y)
    _w,_b=tape.gradient(_loss, [W,B])       # 손실 값을 통한 조정된 가중치 및 편향 정의
    W.assign_sub(learning_rate * _w)        # 조정된 가중치 반영
    B.assign_sub(learning_rate * _b)        # 조정된 편향 반영

@tf.function
def evaluation(H,Y):                                                  # 정확도 계산
    prediction=tf.argmax(H,1)                                         # 예측값
    correct_prediction=tf.equal(prediction, tf.argmax(Y,1))           # 목적값
    accuracy=tf.reduce_mean(tf.cast(correct_prediction, tf.float32))  # 정확도
    return prediction, accuracy

training_epochs = 50       # epoch = 전체 데이터 셋을 학습시키는 횟수
batch_size = 100           # batch = 한번에 메모르에서 처리하는 데이터의 양

for epoch in range(training_epochs):         # epoch횟수만큼 모델을 훈련
    avg_cost=0
    iterations=int(len(x_train)/batch_size)
    idx=0
    for i in range(iterations):
        batch_xs, batch_ys = x_train[idx:idx+batch_size,:], y_train_one_hot[idx:idx+batch_size,:]
        _c=loss(Hypothesis(batch_xs), batch_ys)
        train(batch_xs, batch_ys, learning_rate=0.15)
        avg_cost += _c/iterations
        idx += batch_size
    print("epoch: {:2d} loss: {}".format(epoch+1, avg_cost))

# report accuracy
print("\nAccuracy...")
_h=Hypothesis(x_test)
_p,_a=evaluation(_h, y_test_one_hot)
print("\nAccuracy=",_a.numpy())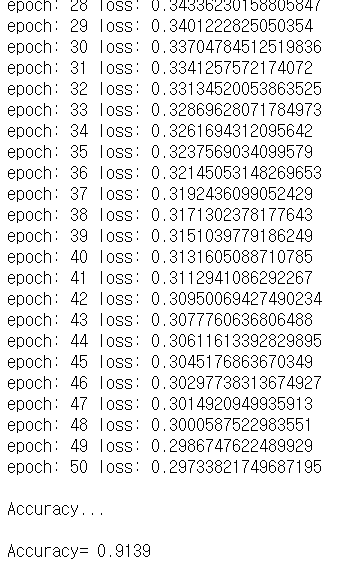
- MNIST 데이터란?
: 고등학생과 미국 인구조사국 직원들이 손으로 쓴 7만개의 작은 숫자 이미지
keras를 활용한 MNIST data 분류 파이썬 예제
import tensorflow as tf
import matplotlib.pyplot as plt

mnist = tf.keras.datasets.mnist
(x_train, y_train), (x_test, y_test) = mnist.load_data()
x_train, x_test = x_train/255.0, x_test / 255.0

plt.figure(figsize=(8,2)) # 8*2 inchs

for i in range(36):
    plt.subplot(3,12,i+1)
    plt.imshow(x_train[i], cmap="gray")
    plt.axis("off")
plt.show()


# define model
model = tf.keras.models.Sequential([
    tf.keras.layers.Flatten(input_shape=(28,28)),
    tf.keras.layers.Dense(10,input_dim=784, activation='softmax')
])


# model compile
model.compile(optimizer='adam',
             loss='sparse_categorical_crossentropy',
             metrics=["accuracy"])

model.summary()

# model fit
hist=model.fit(x_train, y_train,
              validation_data=(x_test, y_test),
              verbose=2, batch_size=100, epochs=15,
              use_multiprocessing=True)


# model evaluate
model.evaluate(x_test, y_test,
              verbose=2, batch_size=100, use_multiprocessing=True)


# Graph print
plt.figure(figsize=(8,4))
plt.subplot(1,2,1)
plt.plot(hist.history['loss'])
plt.title("Cost Graph")
plt.ylabel("cost")
plt.subplot(1,2,2)
plt.title("Accuracy Graph")
plt.ylabel("accuracy")
plt.plot(hist.history['accuracy'], 'b-', label="training accuracy")
plt.plot(hist.history['val_accuracy'], 'r:', label="validation accuracy")
plt.legend()
plt.tight_layout()
plt.show()


# use model
prediction = model.predict(x_test[:1, :])
prediction_class = tf.argmax(prediction, 1)
print(f"\nPrediction Result:\n{prediction}")
print("Predicted class: ", prediction_class.numpy())

plt.imshow(x_test[prediction_class[0]])
plt.grid(False)
plt.axis("off")
plt.show()
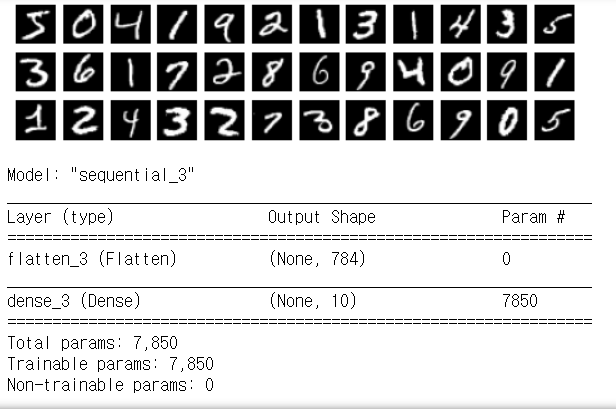


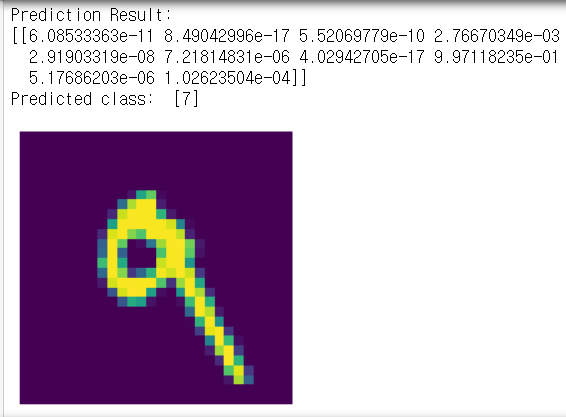
- 결과는 중략하였다. MNIST 데이터셋을 keras를 이용하여 분류하고
정확도 추이를 그래프로 출력하였고 손글씨로 7을 표현한 가장 유사한 데이터(이미지)를 출력하였다
300x250
728x90
'Computer Science > DeepLearning' 카테고리의 다른 글
| Tensorflow를 활용한 Neural Network 구현 (0) | 2020.12.16 |
|---|---|
| 머신러닝 기초 6 - 모델의 저장과 로딩 (0) | 2020.12.16 |
| 머신러닝 기초 4 - 다중 선형회귀 (0) | 2020.12.10 |
| 머신러닝 기초 3 - 회귀분석 (0) | 2020.12.10 |
| 머신러닝 기초 2 - 머신러닝과 학습 / 학습을 위한 최적화 이론 (0) | 2020.12.10 |
